Study guides, Class notes & Summaries
Looking for the best study guides, study notes and summaries about ? On this page you'll find 8 study documents about .
All 8 results
Sort by
-
IHuman New Case Study - all 16 case study{Bundle} with complete solutions
- Package deal • 16 items • 2024
- $19.99
- + learn more
IHuman New Case Study - all 16 case study{Bundle} with complete solutions.
-
BUNDLE FOR iHUMAN CASE STUDIES (23 LATEST CASE STUDIES)
- Package deal • 23 items • 2024
- $25.99
- + learn more
BUNDLE FOR iHUMAN CASE STUDIES (23 LATEST CASE STUDIES)

-
Case Study Report 1: THREE JAYS CORPORATION; Complete solution 2023 new update. Case Study 1 – Three Jays Corporation 831512392 Case Study Report 1: THREE JAYS CORPORATION
- Exam (elaborations) • 13 pages • 2023
- $11.49
- + learn more
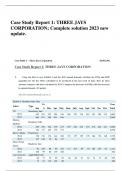
Case Study Report 1: THREE JAYS CORPORATION; Complete solution 2023 new update. Case Study 1 – Three Jays Corporation Case Study Report 1: THREE JAYS CORPORATION 1. Using the data in case Exhibit 4 and the 2012 annual demand, calculate the EOQ and ROP quantities for the five SKUs scheduled to be produced in the last week of June. How do these amounts compare with those calculated in 2011? Compare the increases in EOQs with the increases in annual demand. (2.5 points) The 2012 Annual ...

-
Case Study Report 1: THREE JAYS CORPORATION; Complete solution 2023 new update. Case Study 1 – Three Jays Corporation 831512392 Case Study Report 1: THREE JAYS CORPORATION
- Exam (elaborations) • 13 pages • 2023
- $10.49
- + learn more
Case Study Report 1: THREE JAYS CORPORATION; Complete solution 2023 new update. Case Study 1 – Three Jays Corporation Case Study Report 1: THREE JAYS CORPORATION 1. Using the data in case Exhibit 4 and the 2012 annual demand, calculate the EOQ and ROP quantities for the five SKUs scheduled to be produced in the last week of June. How do these amounts compare with those calculated in 2011? Compare the increases in EOQs with the increases in annual demand. (2.5 points) The 2012 Annual ...
-
Case Study Report 1: THREE JAYS CORPORATION;
- Exam (elaborations) • 13 pages • 2023
- $10.99
- + learn more
Case Study Report 1: THREE JAYS CORPORATION; Complete solution 2023 new update. Case Study 1 – Three Jays Corporation Case Study Report 1: THREE JAYS CORPORATION 1. Using the data in case Exhibit 4 and the 2012 annual demand, calculate the EOQ and ROP quantities for the five SKUs scheduled to be produced in the last week of June. How do these amounts compare with those calculated in 2011? Compare the increases in EOQs with the increases in annual demand. (2.5 points) The 2012 Annual ...

As you read this, a fellow student has made another $4.70


-
Case Study Report 1: THREE JAYS CORPORATION; Complete solution 2023 new update.
- Exam (elaborations) • 13 pages • 2023
- $12.49
- + learn more
Case Study Report 1: THREE JAYS CORPORATION; Complete solution 2023 new update. Case Study 1 – Three Jays Corporation Case Study Report 1: THREE JAYS CORPORATION 1. Using the data in case Exhibit 4 and the 2012 annual demand, calculate the EOQ and ROP quantities for the five SKUs scheduled to be produced in the last week of June. How do these amounts compare with those calculated in 2011? Compare the increases in EOQs with the increases in annual demand. (2.5 points) The 2012 Annual ...
-
Case Study Report 1: THREE JAYS CORPORATION; Complete solution.
- Exam (elaborations) • 12 pages • 2023
- $9.99
- + learn more
Case Study Report 1: THREE JAYS CORPORATION; Complete solution.

-
THREE JAYS CORPORATION; Complete Solution.
- Case • 12 pages • 2022
- $13.19
- + learn more
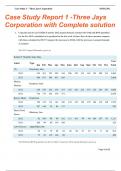
S - The Marketplace to Buy and Sell your Study Material Case Study Report 1: THREE JAYS CORPORATION 1. Using the data in case Exhibit 4 and the 2012 annual demand, calculate the EOQ and ROP quantities for the five SKUs scheduled to be produced in the last week of June. How do these amounts compare with those calculated in 2011? Compare the increases in EOQs with the increases in annual demand. (2.5 points) The 2012 Annual Demand is given as Exhibit 5: Monthly Sal...
