Boxplot Study guides, Class notes & Summaries
Looking for the best study guides, study notes and summaries about Boxplot? On this page you'll find 297 study documents about Boxplot.
Popular textbooks 'Boxplot'
All 297 results
Sort by
-
WGU C207 Final Self-Assessment 2023- 100% verified Q&A Latest update
- Exam (elaborations) • 60 pages • 2023
- $17.99
- 1x sold
- + learn more
Amanda is measuring the temperature. She looks at the thermometer and sees that it is somewhere between 65 and 66 degrees Fahrenheit. She is okay with the temperature in between two integers because she knows temperature is not ________ data, but temperature is _________ data. a) Nominal, Ordinal b) Nominal, Discrete c) Continuous, Discrete d) Discrete, Continuous Feedback: The correct answer is D. Temperature is not a measure that comes in increments (discrete) but is co...
-
CLE 035 Introduction to Probability and Statistics Exam Questions & Answers 2023/2024
- Exam (elaborations) • 3 pages • 2023
- $8.99
- 1x sold
- + learn more
CLE 035 Introduction to Probability and Statistics Exam Questions & Answers 2023/2024 A utility truck manufacture gives a 4-year/30,000 mile warranty on its drive train. Recently a design team proposed two possible materials 1 and 2 that could extend the drive train's life. The truck underwent 30,000 miles of road testing and the drive train failures were recorded. The estimated difference between the proportion of drive train materials p^1-p^2 = (0.017-0.009)=0.008. The 95% confidence interv...
 Popular
-
Duidelijk STAPPENPLAN voor Cursus SPSS!
- Summary • 18 pages • 2023
- $4.38
- 21x sold
- + learn more
In dit stappenplan vind je per onderwerp beschreven welke stappen je moet uitvoeren in SPSS om een bepaalde opdracht uit te voeren. De stappen zijn helder en gedetailleerd omschreven. Met dit stappenplan kan je makkelijk een hoog cijfer halen!
-
Overzicht EXCEL - holy grail bij het maken van de exceltest - statistiek - 1VAS - HOGENT
- Summary • 6 pages • 2023
- $7.13
- 12x sold
- + learn more
Ik had een score van 87% op de test van excel mede door dit overzicht. Onder andere staat er hoe je een bosplot moet opbouwen, stap voor stap, bepaalde formules voor het berekenen van gemiddelde, modus etc. (inclusief screenshots van instellingen)
-
Hoorcolleges Statistiek 1 Pedagogische wetenschappen+
- Class notes • 90 pages • 2023
- $5.48
- 2x sold
- + learn more
Hier staan de hoorcolleges 1.1 tm 6.2 van het vak statistiek 1 heel uitgebreid beschreven. Dit vak is van de opleiding Vrije Universiteit en werd bij mij gegeven tijdens de Premaster (PMC). Er staan veel voorbeelden in waarin uitgelegd wordt hoe je iets berekend. Het heeft mij ontzettend geholpen.

Want to regain your expenses?

-
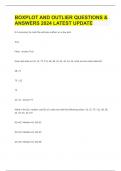
BOXPLOT AND OUTLIER QUESTIONS & ANSWERS 2024 LATEST UPDATE|GUARANTEED SUCCESS
- Exam (elaborations) • 4 pages • 2023
- $12.99
- + learn more
It is necessary to mark the extreme outliers on a box plot. True False True Given the data set 42, 52, 79, 112, 48, 28, 43, 44, 44, 10, 44, what are the mild outlier(s)? 28, 79 79, 112 79 44, 52 79 Brainpower 0:04 / 0:15 What is the Q1, median, and Q3 of a data set with the following values: 42, 52, 79, 112, 48, 28, 43, 44, 44, 10, 44? Q1=42, Median=44, Q3=52 Q1=43, Median=44, Q3=52 Q1=42, Median=44, Q3=48 Q1=43, Median=48, Q3=52 Q1=42, Median=4...

-
BOXPLOT AND OUTLIER QUESTIONS & ANSWERS 2024 LATEST UPDATE
- Exam (elaborations) • 4 pages • 2023
- $14.49
- + learn more
BOXPLOT AND OUTLIER QUESTIONS & ANSWERS 2024 LATEST UPDATE

-
BOXPLOT AND OUTLIER QUESTIONS & ANSWERS 2024 LATEST UPDATE
- Exam (elaborations) • 4 pages • 2023
- $14.49
- + learn more
BOXPLOT AND OUTLIER QUESTIONS & ANSWERS 2024 LATEST UPDATE
-
MATH 112 Shape of the Distribution
- Other • 22 pages • 2023
- $22.49
- + learn more
Department of Mathematics and Natural Sciences Shape of the Distribution 1/1 Measures of Shape Skewness measures the deviation from the symmetry. SK = 3(µ median) (1) SK = 3(¯x median) s (2) Example The scores of the students in the Prelim Exam has a median of 18 and a mean of 16. What does this indicate about the shape of the distribution of the scores? Math031 - Mathematics in the Modern World 2 Boxplot A boxplot is also called a box - and - whisker plot. It is a graphical...
-
Psychologie UU - TOE: Grasple lessen vaardighedentoets Correlationeel en Experimenteel, SPSS en JASP (behaald met een 10)
- Summary • 18 pages • 2023
- $6.58
- 1x sold
- + learn more
In deze samenvatting vind je alle aantekeningen van de Grasple lessen voor Correlationeel 1 en 2 & Experimenteel 1 en 2, voor de vaardighedentoets van TOE in SPSS en JASP. Ik heb de vaardighedentoets gehaald met een 10.
-
Samenvatting Statistiek 1 A (1e jaar psychologie RUG) - Introduction to the practice of Statistics (Moore & McCabe)
- Summary • 12 pages • 2024 Popular
- $6.50
- 4x sold
- + learn more
Samenvatting over de Hoofdstukken 1 t/m 5 van het boek Introduction to the practice of Statistics (Moore & McCabe 10e editie) In deze samenvatting word alle stof voor het tentamen van statistiek 1a behandeld voor 1e jaars studenten van Psychologie aan de Rijksuniversiteit Groningen. De samenvatting is geschreven op Goodnotes en bevat afbeeldingen ter toelichting van de formules/technieken.
