Sta sta2023 Study guides, Class notes & Summaries
Looking for the best study guides, study notes and summaries about Sta sta2023? On this page you'll find 8 study documents about Sta sta2023.
All 8 results
Sort by

-
Stats Exam 1, Top Exam Questions and answers, 100% Accurate, rated A+
- Exam (elaborations) • 20 pages • 2023
- $10.49
- + learn more
Stats Exam 1, Top Exam Questions and answers, 100% Accurate, rated A+ Who uses statistics? - -everyone ex) Business- analyze the results of a marketung campaign statistical methods - -Design, Description, Inference Design - -how you plan to obtain the data survey, experiment, question description - -summarize the data with graphs and numerical summaries. Percent, standard deviation Inference - -use data from a random and representative sample to draw conclusions about the p...

-
STA2023 Key PASSED Exam Questions and CORRECT Answers
- Exam (elaborations) • 6 pages • 2024
- $7.99
- + learn more
0.4332The weight of corn chips dispensed into a 10-ounce bag by the dispensing machine has been identified as possessing a normal distribution with a mean of 10.5 ounces and a standard deviation of 2 ounces. Suppose 100 bags of chips were randomly selected from this dispensing machine. Find the probability that the sample mean weight of these 100 bags falls between 10.50 and 10.80 ounces. 0.0188For the standard normal random variable Z, find p( Z < - 2.08) continuous random variable...

-
STA2023 Certification Exam Questions and CORRECT Answers
- Exam (elaborations) • 4 pages • 2024
- $7.99
- + learn more
Using the unemployment info in the table on Alpha Corporation, determine the width of each class.C- 5 The following data show the number of laps run by each participant in a marathon. 46 65 55 A-302 433689 51567 65 Six college buddies bought each other Christmas gifts. What was mean amount spent?B- $178.48
-
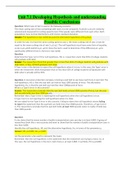
MATH 225N Unit 7.1 Developing Hypothesis and understanding Possible Conclusions
- Exam (elaborations) • 14 pages • 2021
- $15.99
- + learn more
MATH 225N Unit 7.1 Developing Hypothesis and understanding Possible Conclusions>Question: Which type of test is used in the following scenario: The mean cutting rate of two competing table saws is to be compared. Fourteen cuts are randomly selected and measured for cutting speed to test if the speeds were different from each other. Both populations have normal distributions with known standard deviation. Answer: The hypothesis is two-tailed because the alternative hypothesis is Ha:μ1≠μ2...

-
STA 2023 Test 1 GRADED A+ (ACTUAL TEST ) Questions and Answers (Solved)
- Exam (elaborations) • 16 pages • 2023
- $10.99
- + learn more
STA 2023 Test 1 GRADED A+ (ACTUAL TEST ) Questions and Answers (Solved) 1. interquartile range (IQR) Answer: Q3 Q1 2. outlier n a modified boxplot Answer: above Q3, by an amount greater than 1.5 × IQRor below Q1, by an amount greater than 1.5 × IQR. 3. modified boxplot Answer: regular boxplot constructed with these modifications: 1.) A special symbol (such as an asterisk or point) is used to identify outliers asdefined above 2.) the solid horizontal line extends only as far as the...

Make study stress less painful


-
STATISTICS UNIT 7 EXAMPLES QUESTIONS&ANSWERS GRADED
- Exam (elaborations) • 12 pages • 2021
- $15.49
- + learn more
STATISTICS UNIT 7 EXAMPLES GRADED<>Which graph below corresponds to the following hypothesis test? H0:μ≥5.9, Ha:μ<5.9 The alternative hypothesis, Ha, tells us which area of the graph we are interested in. Because the alternative hypothesis is μ<5.9, we are interested in the region less than (to the left of) 5.9, so the correct graph is the first answer choice. Question: Jolyn, a golfer, claims that her drive distance is not equal to 222 meters, on average. Several of her friend...
-
MATH 225N Week 7 Bundle: Homework Assignments, Lab Assignment, Discussion (A+ Solutions & Guide)
- Package deal • 12 items • 2021
- $50.49
- + learn more
MATH 225N Week 7 Bundle: Homework Assignments, Lab Assignment, Discussion (A+ Solutions & Guide)
-
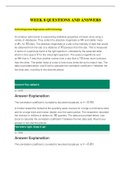
MATH 225N WEEK 1 TO 8, LAB ASSIGNMENTS, HOMEWORK HELP, QUESTIONS & ANSWERS ALL GRADED A, DISCUSSIONS & SAMPLE EXAM QUESTIONS & ANSWERS. (Download to score an A!!)
- Package deal • 40 items • 2021
- $55.49
- 1x sold
- + learn more
MATH 225N WEEK 1 TO 8, LAB ASSIGNMENTS, HOMEWORK HELP, QUESTIONS & ANSWERS ALL GRADED A, DISCUSSIONS & SAMPLE EXAM QUESTIONS & ANSWERS. (Download to score an A!!)
